


XIAMEN, China, Nov. 21, 2022 /PRNewswire/ — Qudian Inc. (“Qudian” or “the Company” or “We”) (NYSE: QD), a consumer-oriented technology company in China, today announced its unaudited financial results for the quarter ended September 30, 2022.
Third Quarter 2022 Operational Highlights:
- Number of outstanding borrowers[1] from loan book business as of September 30, 2022 decreased by 1.7% to 2.39 million from 2.43 million as of June 30, 2022, as a result of the Company’s previously announced decision to cease new credit offerings after September 6, 2022
- Total outstanding loan balance from loan book business[2] decreased by 81.1% to RMB0.1 billion as of September 30, 2022 from RMB0.7 billion as of June 30, 2022
- Amount of transactions from loan book business for this quarter decreased by 73.8% to RMB0.4 billion from the second quarter of 2022
- Weighted average loan tenure for our loan book business was 3.0 months for this quarter, compared to 2.0 months for the second quarter of 2022
|
[1] Outstanding borrowers are borrowers who have outstanding loans from the Company’s loan book business as of a particular date. [2] Includes (i) off and on balance sheet loans directly or indirectly funded by our institutional funding partners or our own capital, net of cumulative write-offs and (ii) does not include auto loans from Dabai Auto business. |
Third Quarter 2022 Financial Highlights:
- Total revenues were RMB110.2 million (US$15.5 million), compared to RMB347.4 million for the same period of last year
- Net loss attributable to Qudian’s shareholders was RMB648.0 million (US$91.1 million), compared to RMB94.2 million for the same period of last year, or net loss of RMB2.64 (US$0.37) per diluted ADS
- Non-GAAP net loss attributable to Qudian’s shareholders[3] was RMB643.9 million (US$90.5 million), compared to RMB99.1 million for the same period of last year, or Non-GAAP net loss of RMB2.63 (US$0.37) per diluted ADS
|
[3] For more information on this Non-GAAP financial measure, please see the table captioned “Unaudited Reconciliation of GAAP and Non-GAAP Results” set forth at the end of this press release. |
“In the third quarter of 2022, as the Company continued to undergo a business transition, we dedicated our efforts to smoothly winding down the loan book business and streamlining QD Food in an orderly manner while preserving the health of our balance sheet by pursuing efficient cash management,” said Mr. Min Luo, Founder, Chairman and Chief Executive Officer of Qudian. “Moving forward, we will remain focused on exploring new business propositions and investment opportunities, including those overseas, in order to create new growth engines and drive sustainable value for all our stakeholders in the long run.”
Third Quarter Financial Results
Total revenues were RMB110.2 million (US$15.5 million), representing a decrease of 68.3% from RMB347.4 million for the third quarter of 2021.
Financing income totaled RMB35.3 million (US$5.0 million), representing a decrease of 87.6% from RMB285.5 million for the third quarter of 2021, as a result of the decrease in the average on-balance sheet loan balance.
Loan facilitation income and other related income decreased by 22.4% to RMB6.8 million (US$1.0 million) from RMB8.8 million for the third quarter of 2021, as a result of the reduction in transaction volume of off-balance sheet loans during this quarter.
Transaction services fee and other related income decreased to RMB2.8 million (US$0.4 million) from RMB20.9 million for the third quarter of 2021, mainly as a result of the winding down of the transaction service business.
Sales income and others increased to RMB50.4 million (US$7.1 million), which was mainly attributable to sales income generated by QD Food, from RMB7.3 million for the third quarter of 2021, which was mainly attributable to sales generated by the Wanlimu e-commerce platform. We have streamlined the QD Food business.
Total operating costs and expenses increased to RMB410.6 million (US$57.7 million) from RMB273.2 million for the third quarter of 2021.
Cost of revenues increased by 125.9% to RMB236.2 million (US$33.2 million) from RMB104.6 million for the third quarter of 2021, primarily due to the increase in the cost of goods sold relating to QD Food.
Sales and marketing expenses increased by 437.7% to RMB176.8 million (US$24.9 million) from RMB32.9 million for the third quarter of 2021, primarily due to the increase in marketing expenses related to QD Food.
General and administrative expenses decreased by 60.0% to RMB63.1 million (US$8.9 million) from RMB157.7 million for the third quarter of 2021, primarily due to the downsizing of the WLM Kids business.
Research and development expenses decreased by 56.6% to RMB17.4 million (US$2.4 million) from RMB40.1 million for the third quarter of 2021, as a result of the decrease in staff head count, which led to a corresponding decrease in staff salaries.
Provision for receivables and other assets was a reversal of RMB63.6 million (US$8.9 million) for the third quarter of 2022, mainly due to the decrease in past-due on-balance sheet outstanding principal receivables compared to the third quarter of 2021.
Impairment loss from long-lived assets was RMB5.9 million (US$0.8 million) for the third quarter of 2022, as a result of the streamlining in QD Food operations.
As of September 30, 2022, the total balance of outstanding principal and financing service fee receivables for on-balance sheet transactions for which any installment payment was more than 30 calendar days past due was RMB51.8 million (US$7.3 million), and the balance of allowance for principal and financing service fee receivables at the end of the period was RMB61.1 million (US$8.6 million), indicating M1+ Delinquency Coverage Ratio of 1.2x.
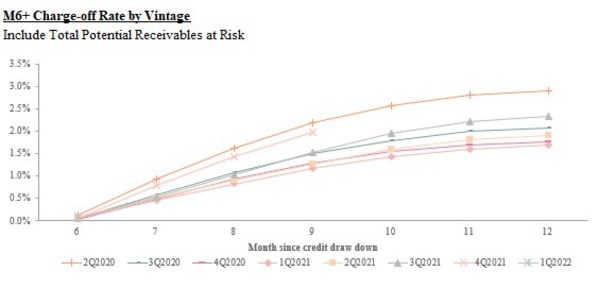
The following charts display the “vintage charge-off rate.” Total potential receivables at risk vintage charge-off rate refers to, with respect to on- and off-balance sheet transactions facilitated under the loan book business during a specified time period, the total potential outstanding principal balance of the transactions that are delinquent for more than 180 days up to twelve months after origination, divided by the total initial principal of the transactions facilitated in such vintage. Delinquencies may increase or decrease after such 12-month period.
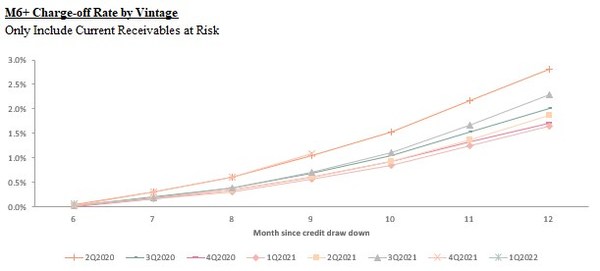
Current receivables at risk vintage charge-off rate refers to, with respect to on- and off-balance sheet transactions facilitated under the loan book business during a specified time period, the actual outstanding principal balance of the transactions that are delinquent for more than 180 days up to twelve months after origination, divided by the total initial principal of the transactions facilitated in such vintage. Delinquencies may increase or decrease after such 12-month period.
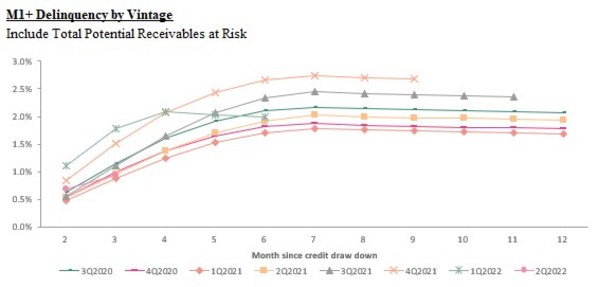
Total potential receivables at risk M1+ delinquency rate by vintage refers to, with respect to on- and off-balance sheet transactions facilitated under the loan book business during a specified time period, the total potential outstanding principal balance of the transactions that are delinquent for more than 30 days up to twelve months after origination, divided by the total initial principal of the transactions facilitated in such vintage. Delinquencies may increase or decrease after such 12-month period.
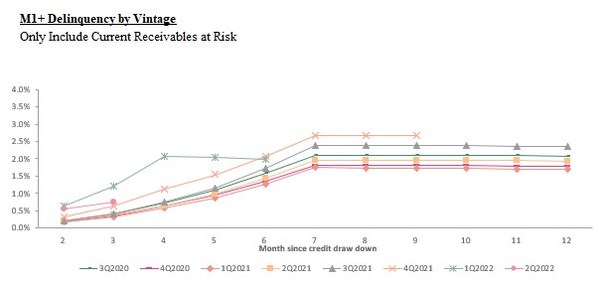
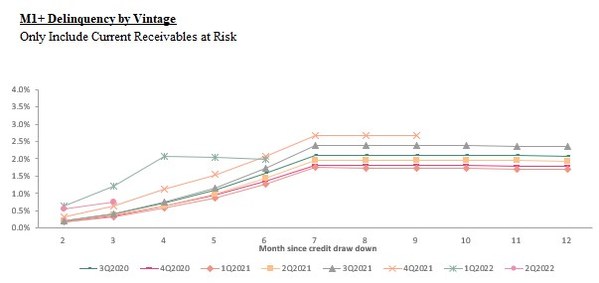
Current receivables at risk M1+ delinquency rate by vintage refers to, with respect to on- and off-balance sheet transactions facilitated under the loan book business during a specified time period, the actual outstanding principal balance of the transactions that are delinquent for more than 30 days up to twelve months after origination, divided by the total initial principal of the transactions facilitated in such vintage. Delinquencies may increase or decrease after such 12-month period.
Loss from operations was RMB299.8 million (US$42.1 million), compared to income from operations of RMB82.8 million for the third quarter of 2021.
Net loss attributable to Qudian’s shareholders was RMB648.0 million (US$91.1 million), or net loss of RMB2.64 (US$0.37) per diluted ADS.
Non-GAAP net loss attributable to Qudian’s shareholders was RMB643.9 million (US$90.5 million), or Non-GAAP net loss of RMB2.63 (US$0.37) per diluted ADS.
Cash Flow
As of September 30, 2022, the Company had cash and cash equivalents of RMB3,002.9 million (US$422.1 million) and restricted cash of RMB224.4 million (US$31.6 million). Restricted cash mainly represents security deposits held in designated bank accounts for the guarantee of on-and-off balance sheet transactions. Such restricted cash is not available to fund the general liquidity needs of the Company.
For the third quarter of 2022, net cash used in operating activities was RMB469.2 million (US$66.0 million), mainly due to payments paid to suppliers and employees, and partially offset by cash received from investment gain. Net cash provided by investing activities was RMB500.1 million (US$70.3 million), mainly due to the net proceeds from the collection of loan principal. Net cash used in financing activities was RMB178.4 million (US$25.1 million), mainly due to the repurchase of ordinary shares and convertible senior notes.
Update on Share Repurchase
As of the date of this release, the Company has cumulatively completed total share repurchases of approximately US$591.3 million.
About Qudian Inc.
Qudian Inc. (“Qudian”) is a consumer-oriented technology company in China. The Company historically focused on providing credit solutions to consumers. Qudian is exploring innovative consumer products and services to satisfy Chinese consumers’ fundamental and daily needs by leveraging its technology capabilities.
For more information, please visit http://ir.qudian.com.
Use of Non-GAAP Financial Measures
We use adjusted net income/loss, a Non-GAAP financial measure, in evaluating our operating results and for financial and operational decision-making purposes. We believe that adjusted net income/loss helps identify underlying trends in our business by excluding the impact of share-based compensation expenses, which are non-cash charges, and convertible bonds buyback income, which is non-cash and non-recurring. We believe that adjusted net income/loss provides useful information about our operating results, enhances the overall understanding of our past performance and future prospects and allows for greater visibility with respect to key metrics used by our management in its financial and operational decision-making.
Adjusted net income/loss is not defined under U.S. GAAP and is not presented in accordance with U.S. GAAP. This Non-GAAP financial measure has limitations as analytical tools, and when assessing our operating performance, cash flows or our liquidity, investors should not consider them in isolation, or as a substitute for net loss /income, cash flows provided by operating activities or other consolidated statements of operation and cash flow data prepared in accordance with U.S. GAAP.
We mitigate these limitations by reconciling the Non-GAAP financial measure to the most comparable U.S. GAAP performance measure, all of which should be considered when evaluating our performance.
For more information on this Non-GAAP financial measure, please see the table captioned “Unaudited Reconciliation of GAAP and Non-GAAP Results” set forth at the end of this press release.
Exchange Rate Information
This announcement contains translations of certain RMB amounts into U.S. dollars (“US$”) at specified rates solely for the convenience of the reader. Unless otherwise stated, all translations from RMB to US$ were made at the rate of RMB7.1135 to US$1.00, the noon buying rate in effect on September 30, 2022 in the H.10 statistical release of the Federal Reserve Board. The Company makes no representation that the RMB or US$ amounts referred could be converted into US$ or RMB, as the case may be, at any particular rate or at all.
Statement Regarding Preliminary Unaudited Financial Information
The unaudited financial information set out in this earnings release is preliminary and subject to potential adjustments. Adjustments to the consolidated financial statements may be identified when audit work has been performed for the Company’s year-end audit, which could result in significant differences from this preliminary unaudited financial information.
Safe Harbor Statement
This announcement contains forward-looking statements. These statements are made under the “safe harbor” provisions of the United States Private Securities Litigation Reform Act of 1995. These forward-looking statements can be identified by terminology such as “will,” “expects,” “anticipates,” “future,” “intends,” “plans,” “believes,” “estimates” and similar statements. Among other things, the expectation of its collection efficiency and delinquency, contain forward-looking statements. Qudian may also make written or oral forward-looking statements in its periodic reports to the SEC, in its annual report to shareholders, in press releases and other written materials and in oral statements made by its officers, directors or employees to third parties. Statements that are not historical facts, including statements about Qudian’s beliefs and expectations, are forward-looking statements. Forward-looking statements involve inherent risks and uncertainties. A number of factors could cause actual results to differ materially from those contained in any forward-looking statement, including but not limited to the following: Qudian’s goal and strategies; Qudian’s expansion plans; Qudian’s future business development, financial condition and results of operations; Qudian’s expectations regarding demand for, and market acceptance of, its products; Qudian’s expectations regarding keeping and strengthening its relationships with customers, business partners and other parties it collaborates with; general economic and business conditions; and assumptions underlying or related to any of the foregoing. Further information regarding these and other risks is included in Qudian’s filings with the SEC. All information provided in this press release and in the attachments is as of the date of this press release, and Qudian does not undertake any obligation to update any forward-looking statement, except as required under applicable law.
For investor and media inquiries, please contact:
In China:
Qudian Inc.
Tel: +86-592-596-8208
E-mail: ir@qudian.com
The Piacente Group, Inc.
Jenny Cai
Tel: +86 (10) 6508-0677
E-mail: qudian@tpg-ir.com
In the United States:
The Piacente Group, Inc.
Brandi Piacente
Tel: +1-212-481-2050
E-mail: qudian@tpg-ir.com
|
QUDIAN INC. |
|||||||
|
Unaudited Condensed Consolidated Statements of Operations |
|||||||
|
Three months ended September 30, |
|||||||
|
(In thousands except for number |
2021 |
2022 |
|||||
|
of shares and per-share data) |
(Unaudited) |
(Unaudited) |
(Unaudited) |
||||
|
RMB |
RMB |
US$ |
|||||
|
Revenues: |
|||||||
|
Financing income |
285,536 |
35,308 |
4,964 |
||||
|
Sales commission fee |
8,037 |
– |
– |
||||
|
Sales income and others |
7,326 |
50,417 |
7,087 |
||||
|
Penalty fee |
16,746 |
14,872 |
2,091 |
||||
|
Loan facilitation income and other related income |
8,776 |
6,806 |
957 |
||||
|
Transaction services fee and other related income |
20,944 |
2,755 |
387 |
||||
|
Total revenues |
347,365 |
110,158 |
15,486 |
||||
|
Operating cost and expenses: |
|||||||
|
Cost of revenues |
(104,551) |
(236,226) |
(33,208) |
||||
|
Sales and marketing |
(32,878) |
(176,797) |
(24,854) |
||||
|
General and administrative |
(157,678) |
(63,121) |
(8,873) |
||||
|
Research and development |
(40,071) |
(17,387) |
(2,444) |
||||
|
Changes in guarantee liabilities and risk assurance liabilities(1) |
42,773 |
25,177 |
3,539 |
||||
|
Provision for receivables and other assets |
19,167 |
63,630 |
8,945 |
||||
|
Impairment loss from long-lived assets |
– |
(5,913) |
(831) |
||||
|
Total operating cost and expenses |
(273,238) |
(410,637) |
(57,726) |
||||
|
Other operating income |
8,693 |
687 |
97 |
||||
|
Income/(Loss) from operations |
82,820 |
(299,792) |
(42,143) |
||||
|
Interest and investment loss, net |
(125,501) |
(73,610) |
(10,348) |
||||
|
Loss from equity method investments |
– |
(44) |
(6) |
||||
|
Loss on derivative instruments |
– |
(358,165) |
(50,350) |
||||
|
Foreign exchange (loss)/gain, net |
(229) |
1,006 |
141 |
||||
|
Other income |
15 |
9,931 |
1,396 |
||||
|
Other expenses |
(2,176) |
(9,587) |
(1,348) |
||||
|
Net loss before income taxes |
(45,071) |
(730,261) |
(102,658) |
||||
|
Income tax expenses |
(50,347) |
82,309 |
11,571 |
||||
|
Net loss |
(95,418) |
(647,952) |
(91,087) |
||||
|
Net loss attributable to non-controlling interest shareholders |
(1,248) |
– |
– |
||||
|
Net loss attributable to Qudian Inc.’s shareholders |
(94,170) |
(647,952) |
(91,087) |
||||
|
Loss per share for Class A and Class B ordinary shares: |
|||||||
|
Basic |
(0.37) |
(2.64) |
(0.37) |
||||
|
Diluted |
(0.37) |
(2.64) |
(0.37) |
||||
|
Loss per ADS (1 Class A ordinary share equals 1 ADSs): |
|||||||
|
Basic |
(0.37) |
(2.64) |
(0.37) |
||||
|
Diluted |
(0.37) |
(2.64) |
(0.37) |
||||
|
Weighted average number of Class A and Class B ordinary shares outstanding: |
|||||||
|
Basic |
253,649,009 |
245,215,663 |
245,215,663 |
||||
|
Diluted |
266,458,506 |
245,215,663 |
245,215,663 |
||||
|
Other comprehensive (loss)/gain: |
|||||||
|
Foreign currency translation adjustment |
(234) |
30,657 |
4,310 |
||||
|
Total comprehensive loss |
(95,652) |
(617,295) |
(86,777) |
||||
|
Less: total comprehensive loss attributable to non-controlling interest shareholders |
– |
– |
– |
||||
|
Total comprehensive loss attributable to Qudian Inc.’s shareholders |
(95,652) |
(617,295) |
(86,777) |
||||
|
Note: and the change in risk assurance liabilities accounted in accordance with ASC 450, “Contingencies” and ASC 460, “Guarantees”. |
|||||||
|
QUDIAN INC. |
||||||
|
Unaudited Condensed Consolidated Balance Sheets |
||||||
|
As of June 30, |
As of September 30, |
|||||
|
(In thousands except for number |
2022 |
2022 |
||||
|
of shares and per-share data) |
(Unaudited) |
(Unaudited) |
(Unaudited) |
|||
|
RMB |
RMB |
US$ |
||||
|
ASSETS: |
||||||
|
Current assets: |
||||||
|
Cash and cash equivalents |
3,098,964 |
3,002,866 |
422,136 |
|||
|
Restricted cash |
257,792 |
224,431 |
31,550 |
|||
|
Derivative instruments-assets |
8,665 |
– |
– |
|||
|
Short-term investments |
5,070,080 |
4,941,568 |
694,675 |
|||
|
Short-term loan principal and financing service fee receivables |
556,095 |
71,774 |
10,090 |
|||
|
Short-term finance lease receivables |
5,602 |
3,060 |
430 |
|||
|
Short-term contract assets |
13,680 |
6,330 |
890 |
|||
|
Other current assets |
2,654,670 |
2,803,957 |
394,174 |
|||
|
Total current assets |
11,665,548 |
11,053,986 |
1,553,945 |
|||
|
Non-current assets: |
||||||
|
Long-term finance lease receivables |
– |
– |
– |
|||
|
Operating lease right-of-use assets |
553,161 |
157,597 |
22,155 |
|||
|
Investment in equity method investee |
119,777 |
120,866 |
16,991 |
|||
|
Long-term investments |
249,257 |
263,639 |
37,062 |
|||
|
Property and equipment, net |
696,128 |
745,425 |
104,790 |
|||
|
Intangible assets |
11,232 |
10,025 |
1,409 |
|||
|
Long-term contract assets |
– |
– |
– |
|||
|
Deferred tax assets, net |
35,831 |
86,405 |
12,147 |
|||
|
Other non-current assets |
426,713 |
430,265 |
60,486 |
|||
|
Total non-current assets |
2,092,099 |
1,814,222 |
255,040 |
|||
|
TOTAL ASSETS |
13,757,647 |
12,868,208 |
1,808,985 |
|||
|
QUDIAN INC. |
||||||
|
Unaudited Condensed Consolidated Balance Sheets |
||||||
|
As of June 30, |
As of September 30, |
|||||
|
(In thousands except for number |
2022 |
2022 |
||||
|
of shares and per-share data) |
(Unaudited) |
(Unaudited) |
(Unaudited) |
|||
|
RMB |
RMB |
US$ |
||||
|
LIABILITIES AND SHAREHOLDERS’ EQUITY |
||||||
|
Current liabilities: |
||||||
|
Short-term borrowings and interest payables |
120,000 |
120,000 |
16,869 |
|||
|
Short-term lease liabilities |
65,686 |
20,418 |
2,870 |
|||
|
Convertible senior notes-short term |
133,962 |
– |
– |
|||
|
Derivative instruments-liability |
77,377 |
418,415 |
58,820 |
|||
|
Accrued expenses and other current liabilities |
527,450 |
509,684 |
71,650 |
|||
|
Guarantee liabilities and risk assurance liabilities(2) |
275 |
102 |
14 |
|||
|
Income tax payable |
47,396 |
104,361 |
14,671 |
|||
|
Total current liabilities |
972,146 |
1,172,980 |
164,894 |
|||
|
Non-current liabilities: |
||||||
|
Deferred tax liabilities, net |
90,795 |
1,385 |
195 |
|||
|
Convertible senior notes |
– |
– |
– |
|||
|
Long-term lease liabilities |
388,474 |
43,506 |
6,116 |
|||
|
Long-term borrowings and interest payables |
25,312 |
25,312 |
3,558 |
|||
|
Other non-current liabilities |
– |
– |
– |
|||
|
Total non-current liabilities |
504,581 |
70,203 |
9,869 |
|||
|
Total liabilities |
1,476,727 |
1,243,183 |
174,763 |
|||
|
Shareholders’ equity: |
||||||
|
Class A Ordinary shares |
132 |
132 |
19 |
|||
|
Class B Ordinary shares |
44 |
44 |
6 |
|||
|
Treasury shares |
(390,271) |
(432,795) |
(60,841) |
|||
|
Additional paid-in capital |
4,027,471 |
4,031,393 |
566,724 |
|||
|
Accumulated other comprehensive loss |
(53,559) |
(22,901) |
(3,219) |
|||
|
Non-controlling interests |
– |
– |
– |
|||
|
Retained earnings |
8,697,103 |
8,049,152 |
1,131,533 |
|||
|
Total shareholders’ equity |
12,280,920 |
11,625,025 |
1,634,222 |
|||
|
TOTAL LIABILITIES AND SHAREHOLDERS’ EQUITY |
13,757,647 |
12,868,208 |
1,808,985 |
|||
|
Note: assurance liabilities accounted in accordance with ASC 450, “Contingencies” and ASC 460, “Guarantees”. |
||||||
|
QUDIAN INC. |
|||||||
|
Unaudited Reconciliation of GAAP And Non-GAAP Results |
|||||||
|
Three months ended September 30, |
|||||||
|
2021 |
2022 |
||||||
|
(In thousands except for number |
(Unaudited) |
(Unaudited) |
(Unaudited) |
||||
|
of shares and per-share data) |
RMB |
RMB |
US$ |
||||
|
Total net loss attributable to Qudian Inc.’s shareholders |
(94,170) |
(647,952) |
(91,087) |
||||
|
Add: Share-based compensation expenses |
7,167 |
4,284 |
602 |
||||
|
Less: Convertible bonds buyback income |
12,082 |
188 |
26 |
||||
|
Non-GAAP net loss attributable to Qudian Inc.’s shareholders |
(99,085) |
(643,856) |
(90,511) |
||||
|
Non-GAAP net loss per share—basic |
(0.39) |
(2.63) |
(0.37) |
||||
|
Non-GAAP net loss per share—diluted |
(0.39) |
(2.63) |
(0.37) |
||||
|
Weighted average shares outstanding—basic |
253,649,009 |
245,215,663 |
245,215,663 |
||||
|
Weighted average shares outstanding—diluted |
266,458,506 |
245,215,663 |
245,215,663 |
||||
 View original content to download multimedia:https://www.prnewswire.com/news-releases/qudian-inc-reports-third-quarter-2022-unaudited-financial-results-301683591.html
Source: Qudian Inc.







